


Key numbers
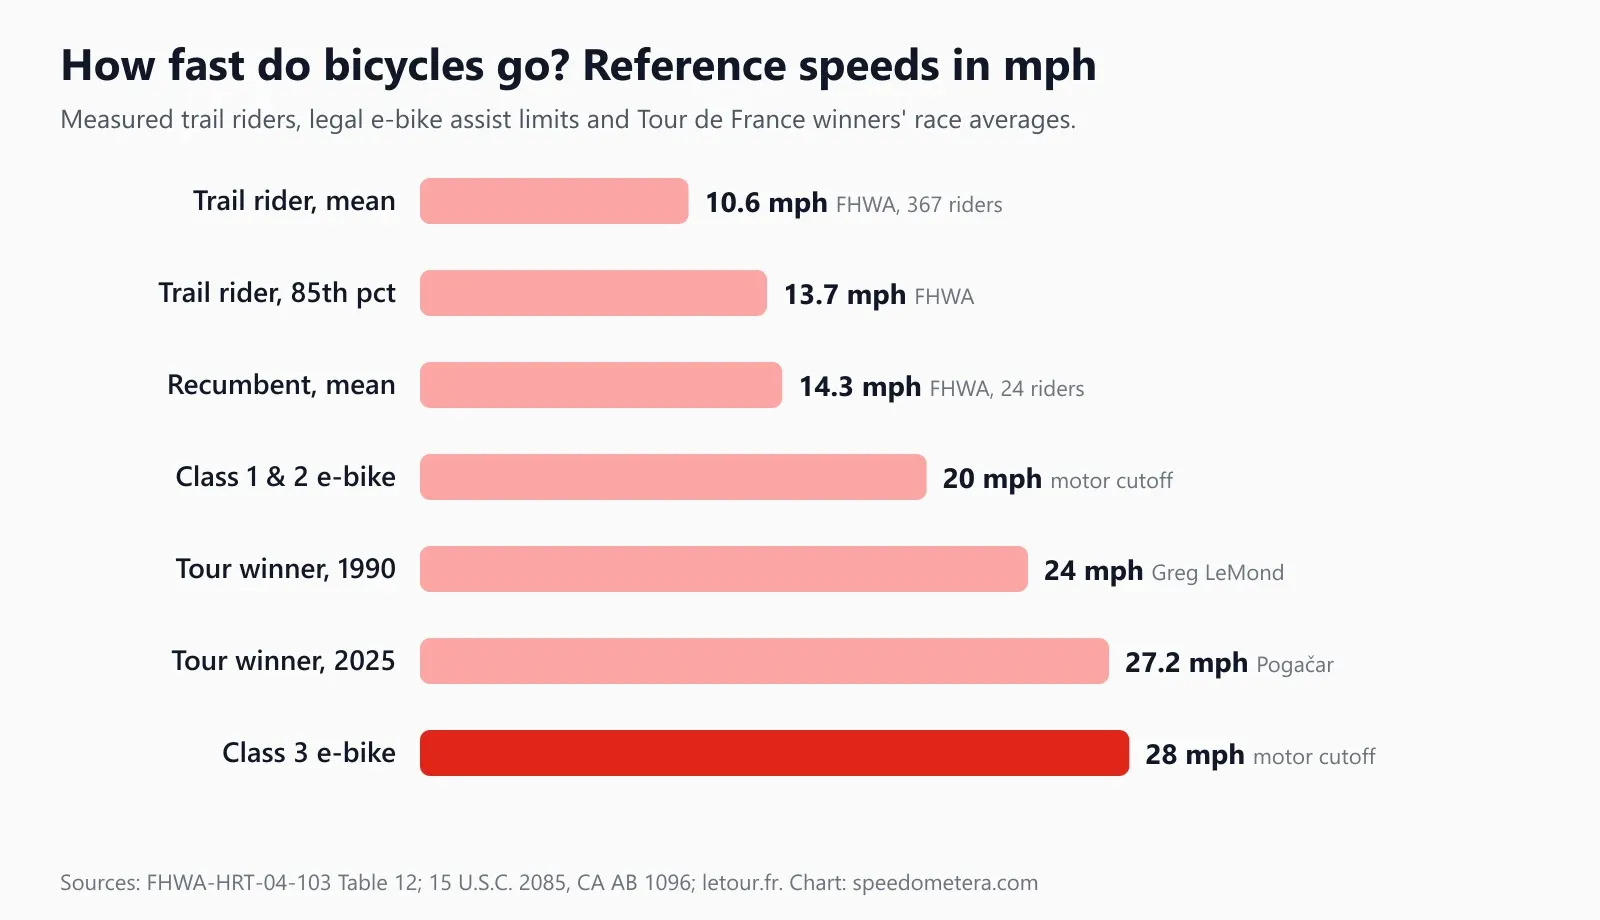
- Measured US trail cyclists averaged 10.6 mph (17 km/h); 85% rode at or below 13.7 mph (FHWA)
- Class 1 and 2 e-bikes stop assisting at 20 mph; Class 3 at 28 mph
- Federal law caps a low-speed electric bicycle at under 750 W and under 20 mph on motor power alone
- Tour de France 2025 winner Tadej Pogačar: 3,323 km in 76h 00m 32s, about 27 mph (43.7 km/h)
- At 12 mph, 10 miles takes 50 minutes; at 16 mph, 37.5 minutes
On this page
- How to use the Average Cycling Speed
- What is the average cycling speed?
- How fast do real cyclists ride? (measured US data)
- What is a good average cycling speed by rider type?
- How fast do e-bikes go? US Class 1, 2 and 3 limits
- How fast is the Tour de France? Average speeds since 1903
- How long does it take to bike 1, 10 or 100 miles?
- What affects your cycling speed?
- How do I measure my bike speed with my phone?
- Cycling speed in context: walking, running and driving
- Frequently asked questions
How to use the Average Cycling Speed
- 1Get a clear view of the skyClip your phone to the handlebar or keep it in a chest or arm pocket.
- 2Tap Start and allow locationYour browser asks for location permission once. The first GPS fix usually arrives in 5–30 seconds.
- 3Pick your unitChoose km/h, mph, knots or m/s. Your choice is remembered on this device.
- 4Read speed, max, average and distanceThe gauge and digital readout update about once a second. Distance and average count only while you are moving.
- 5Stop or resetTap Stop to pause, Reset to clear the trip. Nothing is stored or sent anywhere.
Works in any modern phone browser. Back to the speedometer ↑
What is the average cycling speed?
The average cycling speed for an everyday adult is about 10–12 mph (16–19 km/h); fit riders on road bikes average 15–18 mph on flat ground. The best US measurement comes from the Federal Highway Administration, which clocked real riders on shared-use trails and found a mean of 17 km/h (10.6 mph).
Most “average bike speed” articles quote round numbers without saying where they came from. This page uses measured data instead: an FHWA field study of 367 cyclists on US trails, e-bike class limits written into federal and state law, and Tour de France results from the race organizer. Everything in mph is converted with exact constants (1 mph = 1.609344 km/h). If you’d rather measure yourself, the GPS speedometer above works as a free bike computer on your phone.
Key terms on this page. Average speed is total distance divided by total time; moving average leaves out time stopped. 85th percentile is the speed that 85% of riders were at or below, which traffic engineers use as the “normal upper” speed. A Class 1, 2 or 3 e-bike is a US legal category set by the speed at which the motor must stop helping. Drafting means riding in another rider’s slipstream to cut air resistance.
How fast do real cyclists ride? (measured US data)
On US trails, FHWA measured cyclists at a mean of 10.6 mph; the slowest 15% rode under 6.8 mph and the fastest 15% above 13.7 mph. Only 1% of riders went faster than 20 mph, the design speed engineers use for shared-use paths.
The study, Characteristics of Emerging Road and Trail Users and Their Safety (FHWA-HRT-04-103, 2004), timed trail users on US shared-use paths, both recruited participants and people who happened to be riding by, and published speeds for each user type. It’s the largest public US dataset that measures ordinary riders rather than asking them, and it matches what you see on a bike path on a weekend morning.
| Rider type (FHWA trail study) | Riders timed | 15th percentile | Mean speed | 85th percentile |
|---|---|---|---|---|
| Bicycle (conventional) | 367 | 6.8 mph (11 km/h) | 10.6 mph (17 km/h) | 13.7 mph (22 km/h) |
| Recumbent bicycle | 24 | 11.2 mph (18 km/h) | 14.3 mph (23 km/h) | 18.0 mph (29 km/h) |
| Path design speed (AASHTO) | — | — | — | 20 mph (30 km/h) minimum |
The km/h figures are FHWA’s; mph is converted and rounded to 0.1. Two lessons come out of it. First, a “normal” cyclist is slower than most fitness blogs suggest: 10–11 mph, not 15. Second, recumbents were the fastest group, about 3.7 mph quicker on average, because the reclined position cuts air drag. FHWA notes that its 85th percentile of 14 mph sits well under the 20 mph path design speed in the AASHTO bike guide, so that standard may be conservative for ordinary bikes.
Trail data skews toward relaxed riding. Commuters on roads and club riders in training ride faster, which is why we treat the FHWA figure as the floor for “average” and give wider ranges by rider below.
What is a good average cycling speed by rider type?
A good average for a casual rider is 10–12 mph, for a regular commuter 12–15 mph, for a fit club rider 16–20 mph and for a pro racer 25+ mph over a long race. These bands are our estimates anchored to the FHWA measurements and the race results on this page, not survey data, so use them as rough benchmarks.
| Rider and bike | Typical moving average | km/h | What it looks like |
|---|---|---|---|
| Kids, cruisers, bike-share | 6–10 mph | 10–16 | FHWA’s slowest 15% rode under 6.8 mph |
| Casual adult, hybrid bike | 10–12 mph | 16–19 | Matches FHWA’s 10.6 mph trail mean |
| Regular commuter, flat city | 12–15 mph | 19–24 | Above FHWA’s 85th percentile of 13.7 mph |
| Mountain bike on singletrack | 5–10 mph | 8–16 | Terrain, not fitness, sets the pace |
| Fit rider, road bike, solo | 16–20 mph | 26–32 | Only 1% of FHWA trail riders topped 20 mph |
| Group ride, drafting | 18–24 mph | 29–39 | Shared pulls at the front |
| Tour de France winner (whole race) | 24–27 mph | 39–44 | letour.fr, 1990–2025 |
A few practical points. A route’s average is always lower than the speed you cruise at, because stops, corners and climbs pull it down. Strava-style apps usually show moving average, which excludes stopped time; the speedometer above also counts average only while you’re moving. And ranges by age are mostly guesswork online: we found no US primary source that measures cycling speed by age group, so we don’t publish one.
Is 10, 15, 20 or 25 mph fast on a bike?
10 mph is an average, relaxed pace, 15 mph is fast for an everyday rider, 20 mph is fast for an amateur riding alone, and 25 mph is race speed. The table puts each speed next to the FHWA trail measurements and the Tour de France averages on this page. The time per mile helps if you think in segments: “a mile in 4 minutes” is 15 mph.
| Speed | km/h | Time per mile | Is it fast? | Compared with measured data |
|---|---|---|---|---|
| 8 mph | 12.9 | 7:30 | Easy, leisurely | Between FHWA’s 15th percentile (6.8 mph) and the mean |
| 10 mph | 16.1 | 6:00 | Average | Just under FHWA’s 10.6 mph (17 km/h) mean |
| 12 mph | 19.3 | 5:00 | Good casual pace | Faster than the average trail rider |
| 15 mph | 24.1 | 4:00 | Fast for everyday riders | Above FHWA’s 85th percentile of 13.7 mph |
| 17 mph | 27.4 | 3:32 | Fit road rider | Faster than FHWA’s recumbent mean of 14.3 mph |
| 20 mph | 32.2 | 3:00 | Fast amateur, solo | Only 1% of FHWA trail riders exceeded 20 mph |
| 25 mph | 40.2 | 2:24 | Race speed | Tour de France winners average 24–27 mph (letour.fr) |
Metric riders ask the same question in km/h: 17 km/h is almost exactly the FHWA average, 20 km/h (12.4 mph) is a good steady pace and 30 km/h (18.6 mph) is fast for anyone riding alone. Biking 20 miles in an hour means a 20 mph average, which puts you in the fast amateur band above.
Compare yourself fairly
Measure the same flat loop on a calm day, at the same time of day, once a week. Changes of 0.5–1 mph are real progress on a fixed route. Comparing a windy hill ride with someone else’s flat commute tells you nothing.
How fast do e-bikes go? US Class 1, 2 and 3 limits
US e-bikes are sorted by when the motor must stop helping: 20 mph for Class 1 (pedal assist) and Class 2 (throttle), 28 mph for Class 3 (pedal assist, speedometer required). Federal consumer law separately defines a “low-speed electric bicycle” as one with a motor under 750 W that can’t exceed 20 mph on motor power alone.
The three-class system was written into California law by AB 1096 in 2015, and the National Park Service uses the same three definitions for e-bikes in national parks.
| E-bike class | How the motor helps | Assistance stops at | km/h | Typical access (check locally) |
|---|---|---|---|---|
| Class 1 | Only while you pedal | 20 mph | 32.2 | Most bike lanes and paths where bikes are allowed |
| Class 2 | Throttle can propel the bike alone | 20 mph | 32.2 | Similar to Class 1; some trails exclude throttles |
| Class 3 | Only while you pedal; needs a speedometer | 28 mph | 45.1 | Roads and bike lanes; often barred from paths and trails |
| Federal “low-speed electric bicycle” | Motor under 750 W (1 hp) | Under 20 mph on motor alone, 170 lb rider | under 32.2 | CPSC consumer-product definition, not a traffic law |
What the classes mean in practice:
- The limit is on the motor, not the rider. You may pedal a Class 1 bike past 20 mph; the motor simply stops adding power. On a fast descent any bike can go faster than its class.
- States decide where each class can ride. California’s law (per the Assembly committee analysis) keeps Class 3 bikes off bike paths and trails unless they run beside a road or a local rule allows them, bars riders under 14 from Class 3 bikes, requires helmets on Class 3, and lets cities and park agencies restrict Class 1 and 2 bikes on their paths. Age limits and helmet rules vary by state, so check your state DMV or vehicle code before you ride.
- Labels are required. California requires each e-bike to carry a permanent label with its class, top assisted speed and motor wattage.
- Federal land follows the same classes. NPS rules let each park choose which classes it allows; at New River Gorge, for example, all three classes can use park roads but only Class 1 and 2 bikes are allowed on the Stone Cliff Trail.
- Anything faster isn’t an e-bike under these laws. Bikes that assist above 28 mph or use bigger motors may be classed as mopeds or motorcycles, which need registration and a license.
Do e-bike riders actually ride much faster? Less than you’d think. The German Naturalistic Cycling Study (Schleinitz et al., Safety Science, 2017) fitted sensors to riders’ own bikes for about four weeks. Riders of pedelecs (assist to 25 km/h, Europe’s equivalent of Class 1) averaged only 2 km/h (about 1.2 mph) faster than people on regular bikes. Riders of S-pedelecs (assist to 45 km/h, close to Class 3) were 9 km/h (about 5.6 mph) faster. The motor mostly flattens hills and starts; traffic and comfort still set the cruising speed.
How fast is the Tour de France? Average speeds since 1903
Tadej Pogačar won the 2025 Tour de France in 76h 00m 32s over 3,323 km, a race average of about 27 mph (43.7 km/h); the first winner, Maurice Garin in 1903, averaged about 16 mph. Pro speeds have climbed with better roads, lighter bikes, aerodynamics, nutrition and shorter, more intense stages.
We calculated each average by dividing the official race distance by the winner’s total time, both from the Tour de France history pages:
| Year | Winner | Distance (mi / km) | Winning time | Average (mph) | Average (km/h) |
|---|---|---|---|---|---|
| 1903 | Maurice Garin | 1,509 / 2,428 | 94h 33m 14s | 16.0 | 25.7 |
| 1930 | André Leducq | 2,996 / 4,822 | 172h 12m 16s | 17.4 | 28.0 |
| 1950 | Ferdi Kübler | 2,966 / 4,773 | 145h 36m 56s | 20.4 | 32.8 |
| 1970 | Eddy Merckx | 2,643 / 4,254 | 119h 31m 49s | 22.1 | 35.6 |
| 1990 | Greg LeMond | 2,177 / 3,504 | 90h 43m 20s | 24.0 | 38.6 |
| 2015 | Chris Froome | 2,084 / 3,354 | 84h 46m 14s | 24.6 | 39.6 |
| 2024 | Tadej Pogačar | 2,170 / 3,492 | 83h 38m 56s | 25.9 | 41.7 |
| 2025 | Tadej Pogačar | 2,065 / 3,323 | 76h 00m 32s | 27.2 | 43.7 |
Treat the last digit with care. Winning times include time bonuses and, in some years, stages where the race clock for the overall standings was stopped early, so a simple distance-over-time figure can differ slightly from averages published elsewhere. The trend is what matters: American Greg LeMond’s 1990 win averaged 24 mph over three weeks, and today’s winners are roughly 3 mph faster again.
Why pros are so much faster than the rest of us comes down to three things: power (a pro can sustain several times the output of a casual rider for hours), drafting (sitting in the pack saves a large share of the effort at speed) and aerodynamics (position, skin suits and deep-section wheels). A fit amateur riding alone at 18 mph is doing very well; riding at Tour pace for 3,300 km is a different sport.
How long does it take to bike 1, 10 or 100 miles?
At 12 mph a mile takes 5 minutes, 10 miles take 50 minutes and a 100-mile “century” takes 8 hours 20 minutes of riding. Time equals distance divided by average speed, so the table below covers the speeds most riders actually hold.
time = distance ÷ average speed · e.g. 25 mi ÷ 14 mph = 1.79 h = 1:47:09
| Average speed | km/h | 1 mi | 5 mi | 10 mi | 25 mi | 50 mi | 100 mi |
|---|---|---|---|---|---|---|---|
| 8 mph | 12.9 | 7:30 | 37:30 | 1:15:00 | 3:07:30 | 6:15:00 | 12:30:00 |
| 10 mph | 16.1 | 6:00 | 30:00 | 1:00:00 | 2:30:00 | 5:00:00 | 10:00:00 |
| 12 mph | 19.3 | 5:00 | 25:00 | 50:00 | 2:05:00 | 4:10:00 | 8:20:00 |
| 14 mph | 22.5 | 4:17 | 21:26 | 42:51 | 1:47:09 | 3:34:17 | 7:08:34 |
| 16 mph | 25.7 | 3:45 | 18:45 | 37:30 | 1:33:45 | 3:07:30 | 6:15:00 |
| 18 mph | 29.0 | 3:20 | 16:40 | 33:20 | 1:23:20 | 2:46:40 | 5:33:20 |
| 20 mph | 32.2 | 3:00 | 15:00 | 30:00 | 1:15:00 | 2:30:00 | 5:00:00 |
Times are moving time in h:mm:ss (or m:ss), computed with exact mile length (1,609.344 m) and rounded to the second. For a real trip add stops: on a city commute, time at lights and stop signs can pull your overall average well below your moving average. For any other distance or speed, use the speed, distance and time calculator; for a trip with mixed legs (say, 5 miles of traffic and 15 miles of open road), its multi-leg mode gives the true average.
Planning a commute
Your office is 7 miles away and you ride at 12 mph: 7 ÷ 12 = 0.583 h, or 35 minutes of riding. On a Class 1 e-bike averaging 15 mph the same trip is 28 minutes. That 7-minute gap is why e-bikes are popular for longer commutes, even though the top speed difference is small.
What affects your cycling speed?
Air resistance is the biggest factor on flat ground, then hills, rolling resistance and the bike itself. Drag rises with the square of speed, which is why going from 15 to 20 mph is far harder than going from 10 to 15.
- Wind and position. Riding upright on a hybrid catches much more air than a road bike’s lowered position. A headwind can cost several mph; a tailwind gives it back only on the way out. Recumbents were 3.7 mph faster on average in FHWA’s data mostly for this reason.
- Hills. Climbing is about weight against gravity. Even fit riders drop to single digits on steep grades, and the time lost uphill is never fully made up on the descent, so hilly loops average lower.
- Tires and pressure. Narrower, smooth tires at the correct pressure roll faster on pavement; knobby mountain bike tires are slow on roads. Wheel size and tire changes also affect a bike computer’s reading, much as the tire size calculator shows for cars. A GPS speedometer is unaffected.
- Bike type. Road bikes are typically 1–3 mph faster than hybrids and mountain bikes at the same effort on pavement (our estimate from the position and tire differences above).
- Traffic, lights and stops. Every stop costs a restart. Urban average speed is often closer to the FHWA trail mean than to your cruising speed.
- Group riding. Drafting behind another rider saves effort, which is why group rides average higher than solo efforts by the same people.
- Fitness and consistency. Regular riding, a steady pace instead of surges, and fueling on long rides raise your average more than equipment does.
How do I measure my bike speed with my phone?
Mount your phone on the handlebar, tap Start, and the GPS speedometer shows live speed, maximum, moving average and distance; it works in mph or km/h with no app. The gauge on this page runs to about 37 mph (60 km/h), the right scale for a bike.
- Mount the phone on the handlebar in a secure bike mount, screen facing you, or keep it in a jersey or arm pocket if you only want the summary.
- Tap Start and allow location. The first GPS fix takes 5–30 seconds; wait for it before you roll.
- Pick mph or km/h. The tool picks mph automatically in the US and remembers your choice.
- Ride. Speed updates about once a second. Average and distance count only while you’re moving, so stoplights don’t drag your average down.
- Stop or reset at the end. Note your average and top speed, or export the ride as GPX. Nothing is stored or uploaded.
How accurate is it? GPS.gov states that GPS-enabled smartphones are typically accurate to within 4.9 m (16 ft) under open sky. GPS.gov adds that speed accuracy depends on satellite geometry, signal blockage, atmosphere and the receiver itself, so a phone reads best at a steady pace on an open road. Expect lag or jumps under tree cover, between tall buildings, in tunnels and in the first seconds after start. A wheel-sensor bike computer reacts faster to sudden changes, but it reads wrong if its wheel size is set incorrectly. GPS readings are for information, not for legal or race timing.
Ride safely
Don’t handle the phone while riding. Set it up before you start, glance only when the road is clear, and follow local laws on phone use and e-bike class limits. A dropped phone in traffic is dangerous for you and others.
Cycling speed in context: walking, running and driving
A casual cyclist at 10–12 mph is about three times faster than a brisk walker and roughly twice as fast as a recreational runner. That’s why a bike is the quickest human-powered way to cover distance.
For comparison, see the average walking speed page for measured walking speeds by age, and how fast a human can run for jogging paces and sprint records. If you train by pace rather than speed, the pace calculator converts mph to minutes per mile. To track a whole ride’s distance without a speed gauge, use the GPS odometer. Riding abroad or reading a European bike computer? Convert mph to km/h or go back to the main online speedometer.
FAQ
Frequently asked questions
What is a good average speed on a bike?
For most adults, 12–15 mph (19–24 km/h) on flat roads is a good average. A federal trail study found the typical cyclist averaged 10.6 mph and only 15% rode faster than 13.7 mph, so holding 15 mph or more for an hour puts you well above the everyday rider.
Is 20 mph fast on a bike?
Yes. Holding 20 mph (32 km/h) alone on flat ground is fast for an amateur. In FHWA's survey of 367 trail cyclists only 1% exceeded 20 mph. It is also the speed at which Class 1 and Class 2 e-bike motors must stop assisting.
How long does it take to bike 10 miles?
About 50 minutes at 12 mph, an hour at 10 mph and 37.5 minutes at 16 mph. Add a few minutes for stops, traffic lights and hills. Use the speed-distance-time calculator for your own distance and pace.
What is the average speed of a beginner cyclist?
Roughly 8–12 mph (13–19 km/h). FHWA measured a 15th-percentile trail speed of about 6.8 mph and a mean of 10.6 mph, which covers most new and casual riders. Speed rises quickly in the first months of regular riding as fitness and bike handling improve.
How fast do e-bikes go?
US e-bikes are built to stop motor assistance at 20 mph (Class 1 and 2) or 28 mph (Class 3). You can pedal faster without help. A German naturalistic study found pedal-assist riders averaged only about 1.2 mph (2 km/h) faster than riders on conventional bikes, because traffic and comfort limit speed.
What is the average speed of the Tour de France?
The 2025 winner, Tadej Pogačar, covered 3,323 km in 76 hours 0 minutes 32 seconds, roughly 27 mph (43.7 km/h) by simple division. In 1903 Maurice Garin averaged 25.7 km/h (about 16 mph), and Greg LeMond averaged 38.6 km/h (24 mph) in 1990.
How fast does the average person bike a mile?
About 5 to 6 minutes. At the FHWA-measured average of 10.6 mph a mile takes roughly 5 minutes 40 seconds; at 12 mph it takes exactly 5 minutes and at 20 mph exactly 3 minutes.
Is 15 mph fast on a bike?
Yes, for an everyday rider. 15 mph (24.1 km/h) is a 4-minute mile and faster than the 85th-percentile speed of 13.7 mph that FHWA measured on US trails, where the mean was 10.6 mph. Club riders on road bikes often average 16–20 mph solo on flat ground.
Is 20 km/h fast for cycling?
It is a good, above-average pace. 20 km/h is 12.4 mph, a 4:50 mile, faster than the 17 km/h (10.6 mph) mean that FHWA measured for cyclists on US shared-use paths. 17 km/h is almost exactly that average; 25 km/h (15.5 mph) is fast for a commuter.
Is cycling faster than running?
Yes, usually about twice as fast. The typical trail cyclist averages 10.6 mph, while most recreational runners hold 5 to 7.5 mph. At the top, Tour de France winners average 24–27 mph over three weeks, roughly double the 13 mph of the men's marathon world record.
Is a road bike faster than a mountain bike?
Yes, usually by about 1–3 mph on pavement at the same effort, because of narrower, higher-pressure tires, a lower riding position and lighter weight. The gap shrinks on gravel and reverses on rough trails, where a mountain bike's suspension and tires keep you moving.
Can my phone measure my cycling speed?
Yes. Tap Start above and the phone's GPS shows live speed, maximum and average in mph or km/h. Under open sky, GPS.gov says smartphones are typically accurate to within 16 ft (4.9 m); accuracy drops under trees and near tall buildings, so read it at a steady pace.
8 Sources
- FHWA-HRT-04-103: Characteristics of Emerging Road and Trail Users and Their Safety, Table 12 speed data (Oct 2004)
- FHWA-HRT-04-103: 85th-percentile speeds and AASHTO 20 mph path design speed discussion
- 15 U.S.C. 2085: Low-speed electric bicycles (under 750 W, under 20 mph) (Cornell LII)
- California Assembly Transportation Committee: AB 1096 bill analysis, three e-bike classes (2015)
- National Park Service, New River Gorge: e-bike policy and class definitions (Oct 2019)
- Schleinitz et al., The German Naturalistic Cycling Study, Safety Science 92 (2017), TU Dresden
- Tour de France official history: winners, times and race distances, 1903–2025 (letour.fr)
- GPS.gov: GPS accuracy (smartphones and speed)
Last updated October 25, 2026 by Izhar Ahmad Danish. Found an error? Tell us.